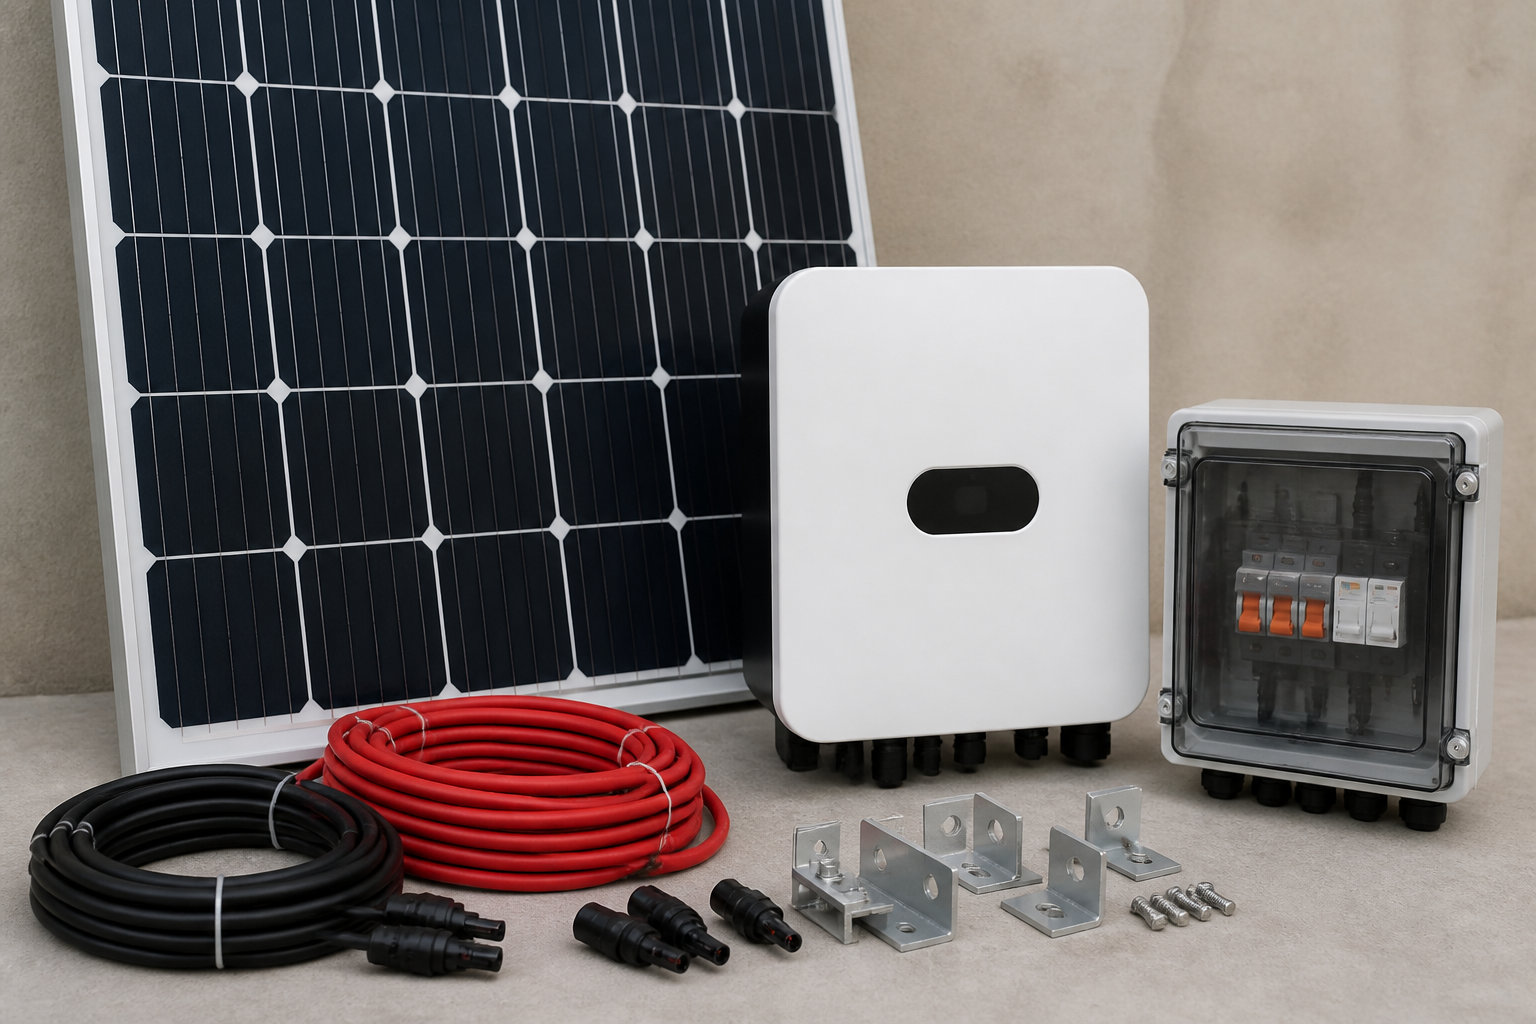
Key takeaway: Residential solar kits typically achieve a break-even point within 6 to 10 years, transforming into high-yield financial assets for the remainder of their 25-year lifespan. By leveraging the 30% federal tax credit and optimizing self-consumption rates up to 90%, homeowners can secure predictable, tax-free energy savings that effectively hedge against volatile utility inflation.
Modern solar panels now maintain 85% efficiency after 25 years, making them one of the most predictable long-term financial assets available to homeowners today. Despite this durability, many people struggle to see past the initial price tag to understand how energy inflation and tax incentives accelerate their break-even point. You might feel overwhelmed by technical jargon, yet failing to accurately calculate your ROI calculation for residential solar kits means leaving thousands of dollars in potential savings on the table.
We are here to simplify the math and show you exactly how to turn your roof into a high-yield investment. We will break down every cost and credit to help you pinpoint your financial finish line.
ROI Calculation for Residential Solar Kits Explained
Solar payback periods typically range from 6 to 10 years, influenced by the 30% federal tax credit and local utility rates. A 25-year system lifespan generates profit long after the initial hardware costs are recovered. This longevity leads into the distinction between short-term break-even and long-term ROI.
Key Definitions
Simple Payback: time to recover net cost via savings. Total ROI: total financial gain over system lifespan.
Simple Payback vs. Total ROI
The payback period represents the moment cumulative energy savings equal the net cost. It marks your financial break-even point. This metric tracks initial cost recovery.
Total ROI accounts for the entire 25-year financial gain. Simple payback ignores the massive earnings generated after the break-even point. It is a limited metric.
Modern Tier 1 solar panels offer extreme durability. Most carry 25-year performance warranties. This longevity is the foundation of solar profitability.
Energy produced in years 11 through 25 is essentially free. This “pure profit” phase significantly boosts the internal rate of return.
A solar kit isn’t just an appliance; it’s a 25-year financial asset that hedge against rising utility costs while providing predictable energy yields.
3 Main Components of Your Upfront Investment
Understanding the final return requires a clear look at what you are spending today on hardware and logistics. To accurately perform a How to calculate the ROI of your residential solar kit assessment, you must first dissect the initial capital outflow.
Solar Hardware and Core Components
Your hardware selection defines your efficiency. You need panels, racking, and wiring. Choosing string inverters saves money upfront. But microinverters, while more expensive, offer superior long-term reliability. Quality gear pays off eventually.
Cost of PV panels per watt
Inverter replacement reserves
Racking and mounting hardware
Balance of system (cables and breakers)
DIY vs. Professional Installation Labor
Labor costs are a massive variable. Professional installation can double the upfront price. However, pros handle the heavy lifting. They manage technical wiring and safety. It is a trade-off between convenience and cash.
DIY kits drastically shorten the payback timeline. You trade your time for significant capital savings. Check out this guide on plug and play solar kit cost to see the difference. Saving on labor accelerates your break-even point.
Labor choice is the biggest variable in your initial budget. It dictates your break-even year.
Permitting and Administrative Fees
Don’t overlook soft costs. Local permits and utility interconnection fees are mandatory. These vary wildly by jurisdiction and utility provider. Budgeting for these prevents nasty surprises later.
Safety inspections are non-negotiable. Certificates like the Consuel in France or local electrical stamps in the US ensure safety standards. They are essential for grid connection and insurance peace of mind.
Administrative Cost Alert
The Consuel certificate costs approximately 200 to 230 euros including tax depending on the installation type.
While costs are fixed at the start, the value of the energy you produce changes based on utility market shifts.
Analyzing Electricity Rate Escalation
Utility prices rarely stay flat. Historical data shows consistent annual increases. This inflation makes every kilowatt-hour produced by solar more valuable every year.
Factor in a 2-3% annual rate hike. This compound effect accelerates your ROI. Solar acts as a fixed-cost hedge against volatile energy markets.
Your future savings grow as the grid becomes more expensive. It is a mathematical certainty.
Federal Tax Credits and Local Incentives
Major Financial Boost
The Federal Investment Tax Credit (ITC) allows for a 30% deduction of total system costs from federal taxes.
The Federal Investment Tax Credit (ITC) is a game-changer. It allows you to deduct 30% of system costs from your taxes. This immediately slashes the net investment.
Local rebates add further value. State-level incentives or utility grants lower the barrier to entry significantly.
Always check for local performance-based incentives. These pay you for the clean energy you generate.
Net Metering and Grid-Based Credits
Net metering allows you to send excess power back to the grid. The utility credits your bill at a specific rate. This maximizes your financial efficiency.
Understand the difference between retail and wholesale credit rates. Direct self-consumption is usually more profitable than selling back, especially when considering the benefits of plug and play solar kits for your home.
Policy changes can impact these credits. Always verify your current utility’s net metering agreement.
Calculating Your Break-Even Point Step-by-Step
Now that we have the variables, let’s run the numbers to find your specific financial finish line.
How to calculate the ROI of your residential solar kit
Determine net cost (total price minus incentives).
Estimate annual production in kWh.
Calculate annual savings (production x utility rate).
Divide net cost by annual savings for the payback period.
Applying the Standard ROI Formula
Use the simple formula: Net Cost divided by Annual Savings. Net cost is the total price minus all incentives. Annual savings is your production multiplied by your utility rate.
This gives you the payback year. It is the most common metric for homeowners.
The simplest way to view solar math is: Total Investment / (Annual Production x Utility Rate) = Years to Break Even.
Accounting for Annual System Degradation
Solar panels lose a tiny bit of efficiency every year. A standard degradation rate is about 0.5%. This must be factored into long-term projections.
While small, this production drop slightly reduces annual savings over decades. Most high-quality panels still produce 85% after 25 years.
The Internal Rate of Return (IRR) is a sophisticated financial tool. It allows you to compare solar against stocks or bonds. Solar often wins.
A typical solar IRR ranges from 10% to 20%. This is often higher than traditional market averages. It is a low-risk, high-yield investment.
Think of your roof as a high-interest savings account. The returns are tax-free energy savings.
3 Ways to Boost Your Long-Term Profit
Beyond the basic math, you can actively improve your returns through smart usage and maintenance.
Impact of Home Electrification
Adding an EV charger or a heat pump increases your on-site consumption. The more solar energy you use yourself, the less you buy from the grid. This maximizes the value of every watt produced.
Higher utilization rates lead to a faster ROI. Electrification turns your solar kit into a powerhouse.
Check out our guide on choosing a solar kit for shed projects to power your outdoor equipment efficiently.
Battery Storage and Financial Returns
Batteries provide energy independence and backup power. However, they increase the upfront cost significantly. This usually extends the simple payback period by several years.
Keep your panels clean to ensure maximum sunlight absorption. Dust and debris can drop production by 5-10%. A simple annual cleaning protects your investment.
Monitor your system’s output via mobile apps. Early detection of component failure prevents long-term losses. Expect an inverter replacement around year 12 or 15.
Mastering your ROI calculation for residential solar kits secures your financial future against rising rates. By combining the 30% federal tax credit with optimized self-consumption, you can slash payback periods to just 7 to 12 years. Turn your roof into a high-yield asset today for decades of pure profit.
FAQ
How do I calculate the return on investment for my solar panels?
Calculating your ROI is simpler than you might think! Use the standard formula: (Total Gains, Cost of Investment) / Cost of Investment. Your gains include annual electricity bill savings, income from selling surplus energy to the grid, and any applicable tax credits or performance incentives. By dividing your net investment by these yearly benefits, you’ll find your payback period, which typically lands between 10 and 15 years.
For a more detailed look, you can also calculate your ROI as a percentage: (Net Profit / Total Investment Cost) x 100. Remember to include “soft costs” like permits and the Consuel certificate (ranging from €200 to €230) in your initial budget. This gives you a crystal-clear picture of when your kit starts generating pure, tax-free profit.
Does the rising cost of electricity make solar kits more profitable?
Absolutely! Inflation in utility rates is actually a massive driver for your solar profitability. When grid prices go up, every kilowatt-hour your residential kit produces becomes more valuable. Since you are “locking in” your energy costs at a fixed rate today, you are effectively hedging against future market volatility and rising energy prices.
In fact, self-consumption is currently the most lucrative strategy. With grid rates often exceeding €0.25/kWh during peak hours, using your own solar power is significantly more rewarding than selling it back for a lower wholesale rate. As utility costs continue to climb, your break-even point arrives much faster, turning your roof into a high-yield financial asset.
What is the typical lifespan and efficiency loss of modern solar panels?
Modern Tier 1 solar panels are built for the long haul, often featuring 25-year performance warranties and a total lifespan exceeding 30 years. While all panels experience a tiny bit of natural “degradation,” high-quality modules only lose about 0.5% efficiency per year. This means even after three decades, your system will likely still operate at over 80% of its original capacity.
To keep your ROI at its peak, simple maintenance is key. Factors like dust, debris, or salt spray can temporarily drop production by 5-10%, so a quick annual cleaning ensures maximum sunlight absorption. By monitoring your output via mobile apps, you can catch any issues early and ensure your kit remains a reliable energy powerhouse for decades to come.
How do hardware costs and labor impact my initial solar investment?
Your upfront investment is generally split into three main buckets: hardware, labor, and administrative fees. Solar panels usually represent about 30% of the total budget, while other components like inverters, racking, and wiring account for another 25%. Choosing a DIY residential kit can drastically shorten your payback timeline by eliminating professional labor costs, which often make up nearly 45% of a traditional installation price.
While equipment prices can fluctuate due to global demand and raw material costs, these are often offset by generous incentives like the 30% Federal Tax Credit or reduced VAT rates. Even with slight shifts in hardware pricing, the long-term savings on your utility bills and the added property value to your home make a solar kit one of the most stable investments available today.