Does your energy storage capacity align with your actual daily consumption and solar production cycles? Accurate solar battery sizing for plug and play kits is required to prevent power interruptions and maximize the return on investment for your installation.
Standard systems often fail due to mismatched loads or excessive depth of discharge. This report details the technical procedures to calculate your kilowatt-hour requirements and adjust for conversion losses to ensure long-term hardware stability.
- Assessment of Solar Battery Sizing for Plug and Play Kits
- 2 Technical Parameters for Storage Capacity Selection
- How to Account for Environmental Production Variables?
- Analysis of System Modularity and Financial Viability
Assessment of Solar Battery Sizing for Plug and Play Kits
Sizing a plug-and-play battery requires matching the 0.3kWh, 0.6kWh base load with LiFePO4 storage. A 2kWh capacity typically covers overnight needs for standard appliances, balancing 80% Depth of Discharge against daily solar production cycles.
The determination of storage capacity begins by distinguishing between continuous energy draw and temporary power surges.
Identification of Base Load Versus Peak Demand
Base load refers to “always-on” energy consumption. Routers, refrigerators, and devices in standby mode represent this category. These components create a constant drain on the system.
Contrast this steady usage with peak demand spikes. High-wattage tools or kettles cause these sudden surges. Mapping these hourly requirements is necessary to identify the optimal storage window.
Accurate monitoring is required to calculate solar power needs effectively. This data ensures the battery handles both loads.
Use Linky meter data or utility apps to track hourly spikes; add a 20% safety margin for future household growth or winter usage.
Calculation of Daily Kilowatt-Hour Usage From Utility Data
Consult the annual utility bill for total consumption. Divide the total kWh figure by 365 days. This calculation provides a raw daily average for the household.
Mobile applications allow for real-time tracking. Identifying evening power spikes is essential to refine capacity needs. This data significantly improves sizing accuracy.
Apply a 20% safety margin to the final figure. This buffer accounts for potential household growth. It also maintains power during high-usage days in winter.
2 Technical Parameters for Storage Capacity Selection
Calculating raw usage is only half the battle; the hardware’s physical limits dictate how much of that energy you can actually touch.
Determination of Depth of Discharge for Battery Longevity
Lithium LiFePO4 batteries have specific limits. Total capacity differs from usable capacity. You must respect the Depth of Discharge (DoD) settings.
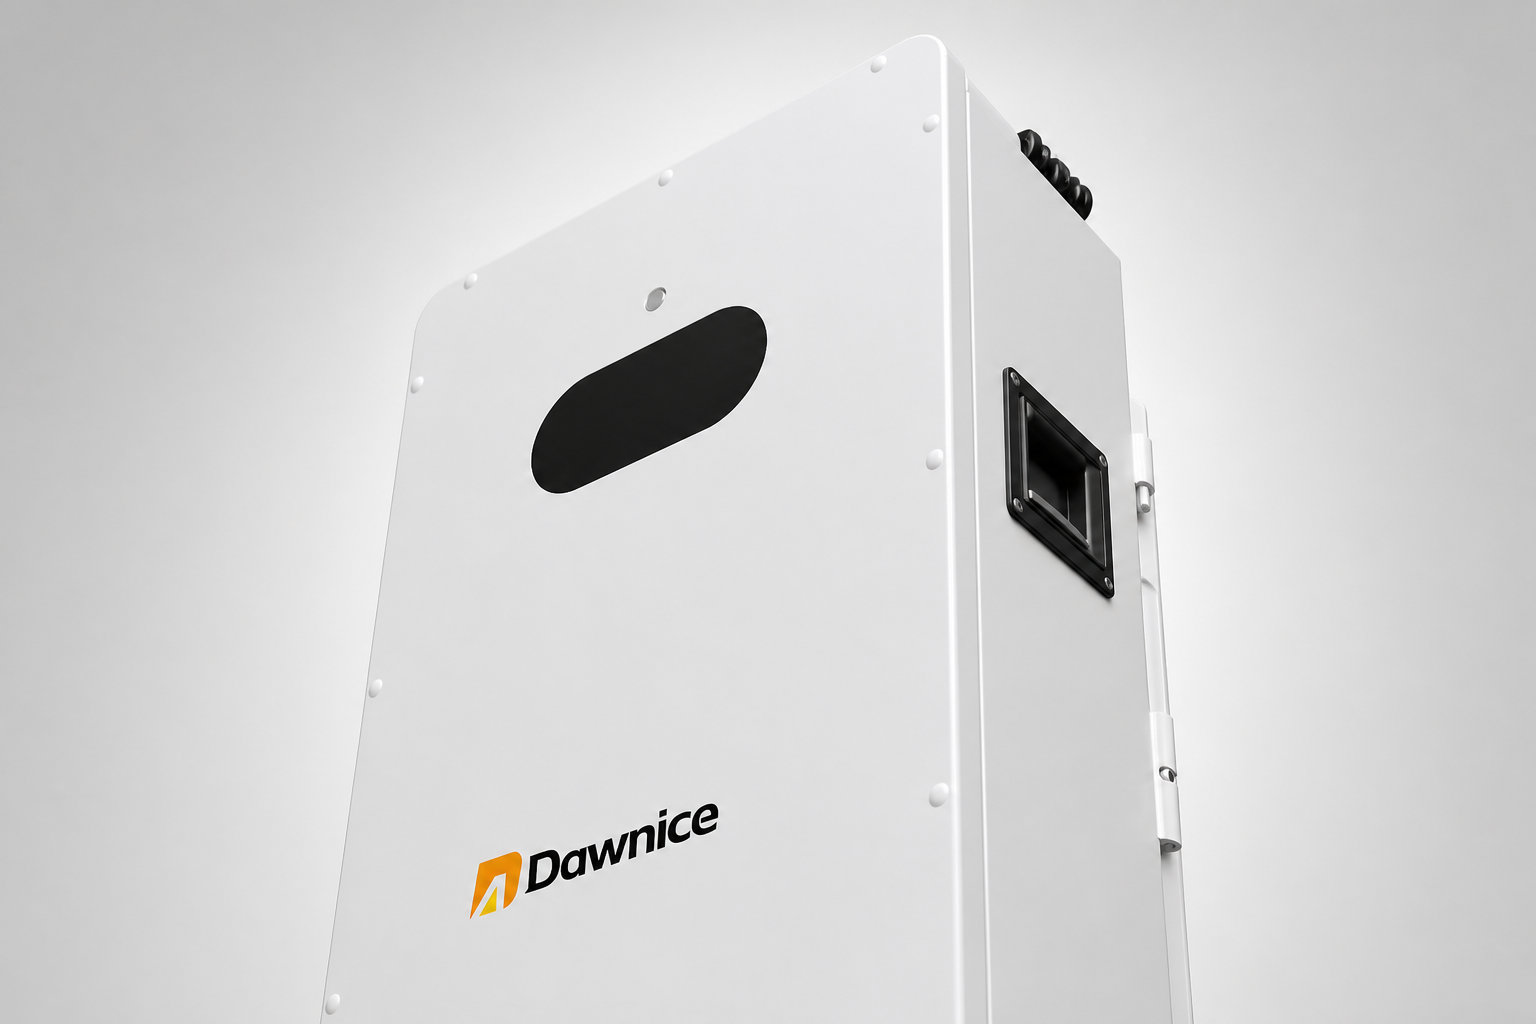
Deep discharge cycles damage the hardware. Aim for an 80-90% limit to ensure longevity. This keeps the battery healthy for many years.
LiFePO4 batteries support 80-90% Depth of Discharge (DoD), whereas lead-acid batteries should only be discharged to 50%.
Maintaining a range between 20% and 80% is ideal. Consult this guide on lithium vs lead-acid solar storage for details. Proper DoD management doubles the expected lifecycle.
Evaluation of AC-DC Conversion Efficiency in Micro-inverters
Energy is lost during DC to AC inversion. Micro-inverters usually operate at 95% efficiency.
Inverter conversion loss is approximately 10%, plus 3% cabling loss. Formula: Energy needed / (inverter efficiency x network efficiency).
Factor in cabling resistance and hub efficiency. These systemic losses reduce your available power. Adjust your required battery capacity upward. This compensates for the heat generated during conversion.
Modern plug-and-play systems typically lose 5% to 10% of their stored energy during the conversion from battery DC to household AC power.
Accurate sizing requires accounting for these 5% to 10% losses. Failure to adjust capacity leads to insufficient power delivery. High-quality micro-inverters minimize these thermal energy dissipations.
How to Account for Environmental Production Variables?
Even the most efficient battery remains at the mercy of the sky and the local climate surrounding your installation.
Adjustment for Seasonal Sunlight Variations
Winter months bring significant production drops. Cloudy weather further reduces the solar harvest. You need to plan for these low irradiance periods.
Determine your required autonomy days. Most users aim for two days of backup. This bridges the gap during consecutive rainy days.
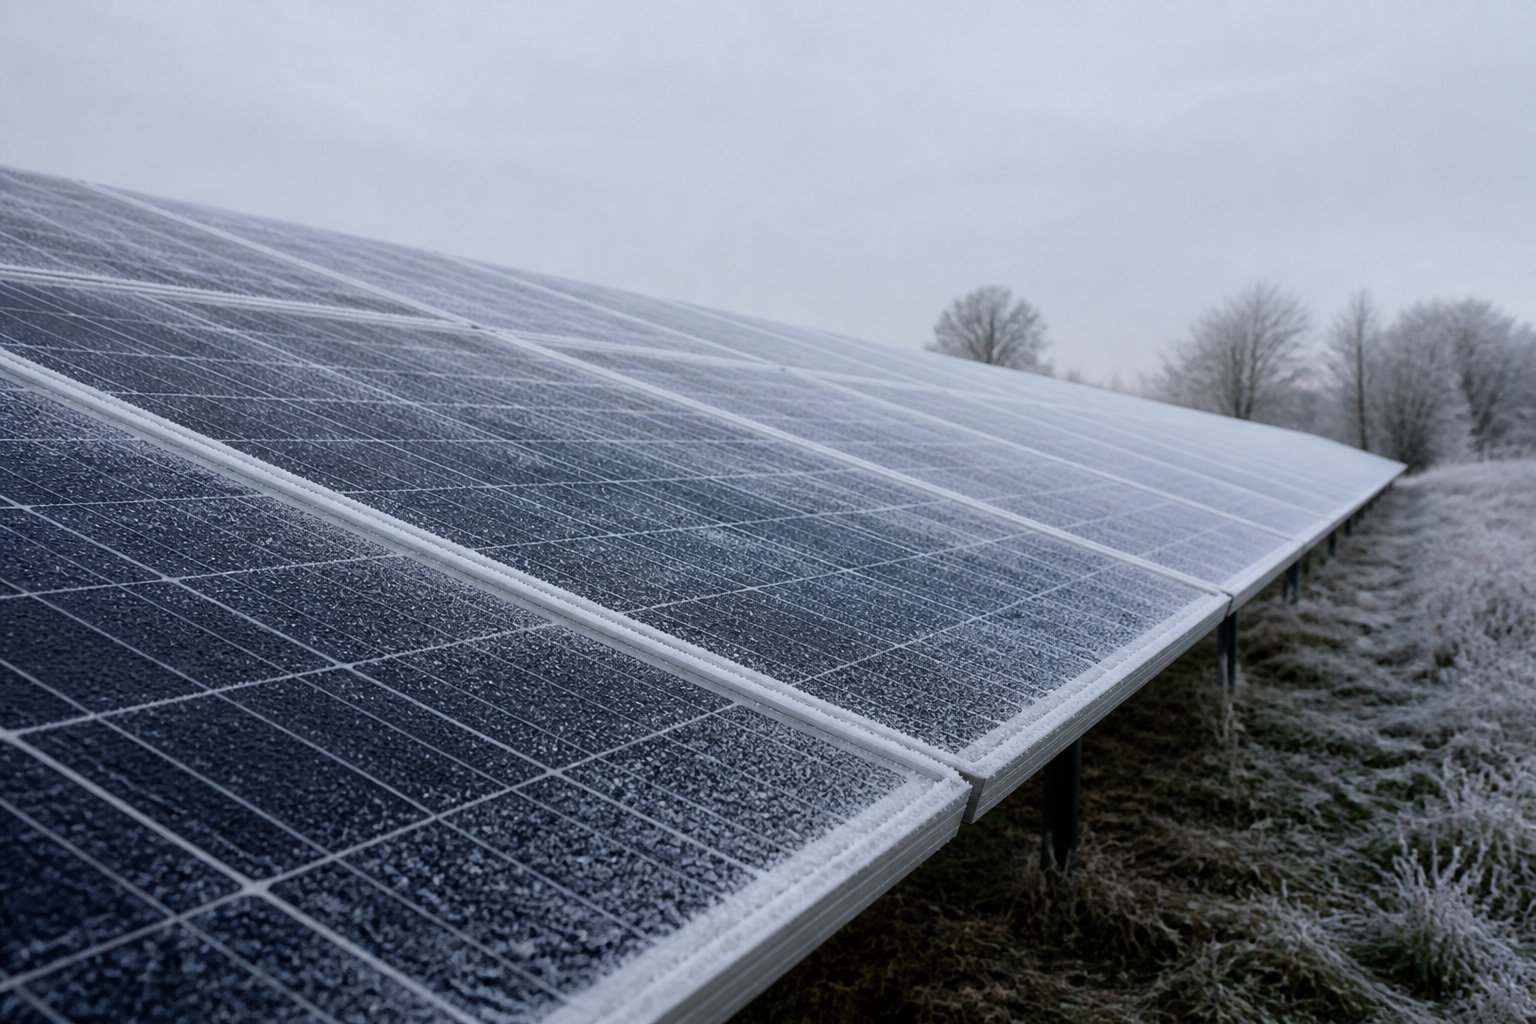
Effective sizing requires understanding mobile solar efficiency extreme climates to maintain power. Local irradiation data helps refine these calculations. Proper planning prevents energy shortages.
Impact of Temperature on Battery Discharge Power
Ambient temperature affects chemical battery performance. Extreme cold slows down the ion movement. This reduces the instantaneous discharge power available.
Optimal operating temperature is 15°C to 25°C. Cold reduces ion movement and discharge power; high heat requires ventilation.
Install units in optimal thermal ranges. Indoor storage is often safer for longevity. Differentiate between storage capacity (kWh) and power (W).
- Optimal operating temperature (15°C to 25°C).
- Capacity loss in freezing conditions.
- Ventilation needs for summer heat.
Analysis of System Modularity and Financial Viability
Beyond the physics of sunlight and chemistry, the final decision rests on how the system grows and pays for itself over time.
Evaluation of Battery Stackability for System Expansion
Modular storage allows for gradual investment. Start with one single battery module first. Test your actual self-consumption rates for a month.
Add battery stacks as energy needs grow. Ensure compatibility between your micro-inverter and the hub. Most modern systems use simple plug-and-play connectors. This makes scaling the system very easy.

Modular units offer flexibility. You avoid over-investing in unnecessary capacity early on.
Comparison of Storage Investment Against Grid Energy Savings
Calculate your return on investment. Compare the battery cost to your local grid rates.
Sometimes batteries are not cost-effective. This happens if your consumption matches production perfectly. Evaluate the trade-off between grid feed-in and storage.
| Scenario | Battery Size | Grid Reliance | ROI Estimate |
|---|---|---|---|
| Low usage | 0.5 kWh | 90% self-consumption | 8-10 years |
| Medium usage | 2 kWh | 75% self-consumption | 10-12 years |
| High usage | 5 kWh | 60% self-consumption | 12-15 years |
| Off-grid office | 10 kWh | 100% self-consumption | Variable |
Accurate solar battery sizing for plug and play kits requires calculating daily consumption, accounting for 13% system losses, and maintaining an 80% Depth of Discharge. Implement these parameters immediately to ensure energy autonomy and protect hardware longevity. Optimal storage configuration secures your future energy independence and maximizes financial returns.
FAQ
How is the depth of discharge calculated for LiFePO4 batteries?
The depth of discharge (DoD) is determined by measuring the discharge current and the duration of use. The formula requires multiplying the discharge current in Amperes by the time in hours to obtain the discharge capacity. This result is then divided by the battery’s total rated capacity and multiplied by 100 to express the value as a percentage.
For example, a 200 Ah battery discharging at 50 A for 0.4 hours results in a 20 Ah discharge. This equates to a 10% depth of discharge. Maintaining a DoD between 80% and 90% is standard procedure to optimize performance and hardware longevity.
What factors influence the lifespan and discharge limits of LiFePO4 storage?
Several variables impact the operational life of lithium storage units. Depth of discharge is primary; frequent cycles approaching 100% accelerate hardware wear. Ambient temperature also affects chemical stability, with optimal performance occurring between 20°C and 25°C. Temperatures exceeding this range cause rapid internal degradation.
Additional factors include the total number of charge cycles, typically ranging from 3,000 to 6,000 for LiFePO4 chemistry. The presence of a Battery Management System (BMS) is essential for monitoring voltage and preventing thermal overload. Efficient charging practices and appropriate load management further ensure the system meets its expected service life.
How does micro-inverter efficiency affect a plug and play solar system?
Micro-inverter efficiency determines the percentage of direct current (DC) successfully converted into usable alternating current (AC). High-quality units typically operate at a maximum efficiency between 97% and 99%. Energy is lost during this process due to internal consumption and heat generation within the device.
Environmental factors and system configuration also influence these rates. The European efficiency rating, which averages performance across various load levels, provides a realistic benchmark, usually around 94%. Proper ventilation and correct power calibration between the solar panel and the micro-inverter are required to minimize conversion losses.
How is the required battery capacity for a solar kit determined?
Capacity sizing begins with an assessment of daily energy consumption. The total annual kilowatt-hour usage is divided by 365 days to establish a daily average. This baseline must be adjusted to account for desired autonomy days, allowing the system to function during periods of low solar production.
The final calculation incorporates energy losses from conversion (10%) and cabling (3%), alongside the Depth of Discharge limit. The formula for total capacity in kWh is: (Daily Consumption x Days of Autonomy) / DoD. This ensures the storage volume is sufficient to meet household demand without damaging the battery cells.